This blog post is based on a Twitter thread I did on March 27, 2020, after seeing Mathieu Rebeaud’s Tweet about a new white paper from the institute of Didier Raoult. That not-yet peer reviewed paper describes a group of 80 COVID-19 patients, all treated with a combination of hydroxychloroquine and azithromycin. This treatment had shown some promising results in a very small, not well-executed study by the same group. Unfortunately, this second study does not have a control group and the patients did not appear to be very sick. So here is my critical review.
Unclear selection of patients
All 80 patients included in this study (Gautret et al., white paper published around March 27 on Mediterranee-infection.com) had been tested positive for the COVID-19 causing virus, SARS-CoV-2 by PCR on a nasopharyngeal swab. It is not clear if they were already admitted to the hospital, or if they were part of the many patients who showed up at the institute after hearing about the miracle treatment by the University Hospital Institute Méditerranée Infection in Marseille, the institute led by infectious disease specialist Dr. Didier Raoult.
After publication of the first paper by Gautret et al. in the International Journal of Antimicrobial Agents (see critical reviews on PubPeer and my blog post), hundreds of people formed a long line in front of the Marseille institute in the hopes of getting tested and receiving the miracle drug mix [Video].
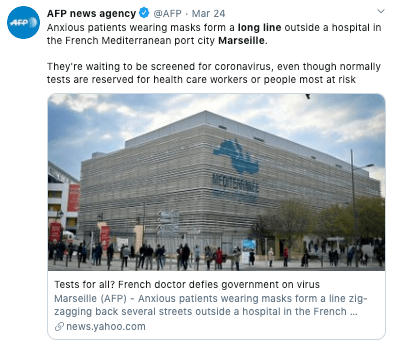
The paper does not clarify if (relatively mildly ill) patients were recruited from the people who showed up for a test, or if they were recruited from (presumably sicker) patients who had already been admitted into the hospital. Hopefully, that information will be added to the study soon.
Either way, all patients that would participate in the study were admitted to the Infectious Diseases ward of the hospital.
Treated patients were not very sick
The paper does tell us a bit about how sick the patients were at the start of the trial.
- At enrollment, 92% of the patients had a “low” score in the National Early Warning Score (NEWS), suggesting they were not very sick.
- The average time between onset of the COVID-19 symptoms and being enrolled in the study was 5 days. This suggests that the patients had already been sick for a while.
- Only 15% of the enrolled patients had a fever. Fever is one of the characteristic symptoms of COVID-19, so people with a positive PCR but no fever are probably only mildly ill, or maybe already recovering.
- Of the 12 patients who had a fever, the mean temperature was 38.6C (101.5 degrees F).
- Only half of the enrolled patients had a lower respiratory tract infection.
- 15% of these patients required oxygen.
- Four patients were asymptomatic.
In short, most of these participants were not patients fighting for their lives breathing through a ventilator in a hospital ICU bed. No, these were people who – at worst – were only mildly sick.
I am just baffled by how these patients were admitted to a hospital ward to be treated, if they were not feeling too bad. One could wonder if they received payment to be included in the study.
Flawed endpoints
The 80 patients were daily tested by coronavirus PCR. Figure 1 of the study shows the number of patients tested (black bars) and the number of patients that were positive in the PCR (tan bars – although they are called “grey” by an apparent color-challenged author). As you can see, the number and percentage of PCR-positive patients rapidly decreased during the 14 days of the study.
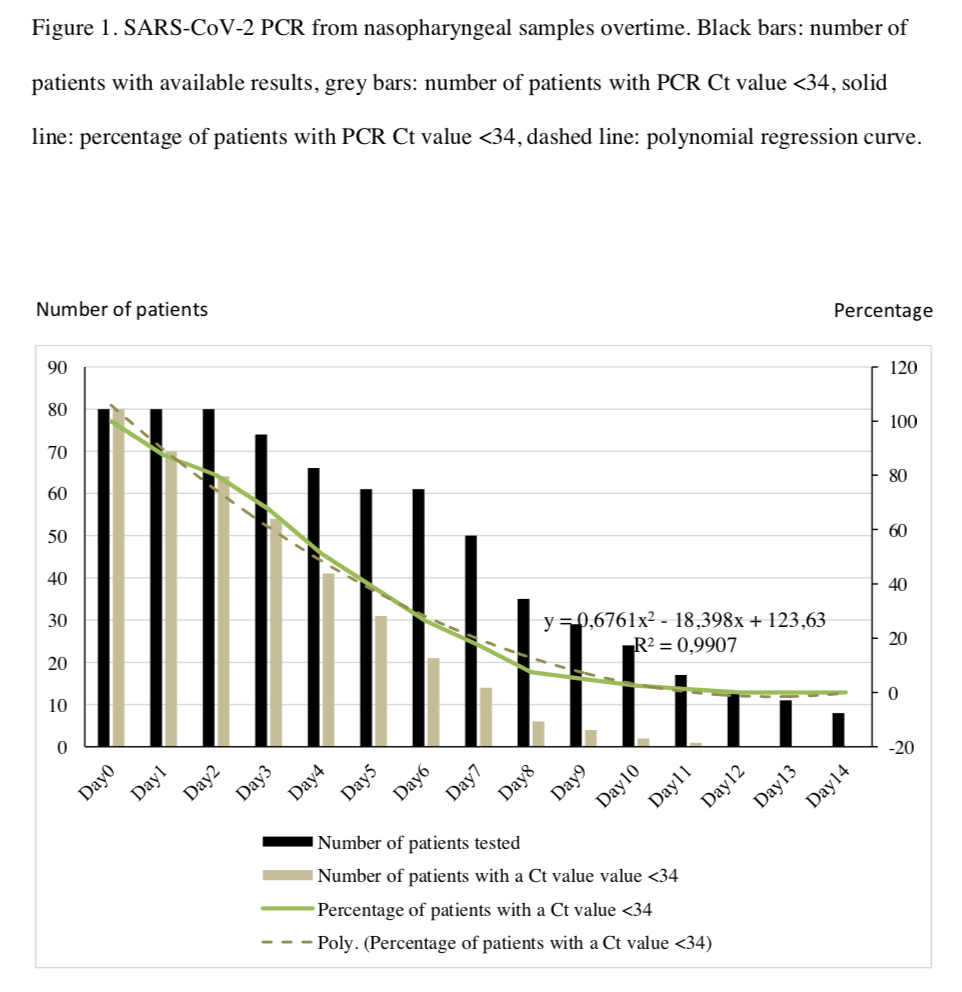
One big red flag here is that not a lot of patients were tested after the first week or so. The tan-bar graph shows a nice decline, but so does the black-bar graph. At Day 7, only 60% of the patients were tested by PCR, and at day 10 only 20%. Why did so many people not get tested? Or were they not tested anymore after two negative PCRs?
The text states that patients were discharged after 1 or 2 successive negative PCRs, or if they were generally doing better, so there is simply no data on whether they remained PCR-negative for most of these patients. This looks shady.
A recent study has shown that SARS-Cov-2 PCR tests have a very high false negative rate, and that test results can be negative one day, and positive the next day (Yafang Li et al., doi: 10.1002/jmv.25786). Even two consecutive days of negative PCR results are no guarantee that the PCR will be negative on the third or fourth day. So dismissing people after 1 or 2 negative PCRs without further testing is not good scientific practice.
One of the patients in this group actually died, and three were transferred to the ICU during the study, but it is not clear if their PCR data is still included in the graph.
It would be much better if other clinical scores would be measured than just focusing on PCR alone. At admission, 92% of the patients had a “low” score for their COVID-19 symptoms, and that number was increased to a whopping 93.8% at discharge from the hospital. So while patients were already not very sick at enrollment, they were almost equally sick at discharge. That does not look like a spectacular improvement – because there was not much to improve to start with.
No control group
This brings us to the biggest flaw of the paper – no control group. A group of 80 relatively mild patients who have hardly any fever and who have already been sick for 5 days is very likely to already been recovering in the next 5 days. So what would have happened if these 80 people had not been treated? It is easy to imagine that they might have recovered by themselves.
Or – as Nick Brown wrote on Twitter, they would have probably found the same results if they had given chocolate pudding to the patients.
Unfortunately, Dr. Raoult does not think that control groups or randomized trials are needed in infectious disease studies, a view not shared by many others. His point of view is that it would be unethical to withhold a working drug from a sick patient. Other people, however, dare to question if the drug has been proven to work – or if these patients were really sick.
Additional reading
- Hydroxychloroquine and azithromycin versus COVID-19: Grift, conspiracy theories, and another bad study by Didier Raoult – David Gorski – ScienceBasedMedicine
- More on Chloroquine/Azithromycin. And On Dr. Raoult. – Derek Lowe – In the Pipeline – Science Translational Medicine
- A detailed analysis of discrepant numbers and percentages from this and the previous Gautret et al. study by Lu Chen on Twitter.


“Also, at Day 14, the percentage of tested patients appears to be lower than 0%, which might be an error, or just my complete lack of understanding negative percentages.”
I think it is more a misreading of the chart. There is no “percentage tested patients” in the chart, only number of patients tested?
LikeLike
The graph has two Y-axis, and the one on the right shows “Percentage”. That is the one that appears applicable for the green line (percentage of patients) and dashed grey line (regression curve). I have changed my wording to make this more clear.
LikeLike
Ah, now I understand. It’s the polynomal that goes, briefly, to below zero. That shows what happens if you use a rather naïve fitting. To me it doesn’t look like the green line goes below zero?
LikeLike