
“Are you looking to buy your own custom-made scientific paper? You have come to the right place. We are the Stock Photo Paper Mill! You can pick and choose all kinds of great items from our pool of stock photos to create your own paper. We have photos featuring colony formation, wound healing, and transwell assays. We have survival plots and flow cytometry panels too! Just pick what you like from our catalog, and we will turn your selection into your own, unique paper. “
A hypothetical commercial for a paper mill.
Stock photos are photos that you can pick and buy from a catalog. Some sites even offer free stock photos. Stock photos are often used by new sites and bloggers to illustrate their stories. Some photos can even be funny, especially if they depict models pretending to be professionals. On MicrobiomeDigest.com I have several blog posts about laboratory stock photo fails that might make you smile.
Here I will discuss the Stock Photo Papers, a set of 121 papers, almost exclusively published in the same scientific journal. The papers all have different authors from different institutions, and describe different cancer types and tissue samples.
However, although each of these papers looks unique at first glance, all papers in this set contain images from the same library of about 100 photos and plots. Like images in a stock photo library, each of these photos was used multiple times in different papers. My findings, covered by Eva Xiao in the Wall Street Journal, suggest that they were all created by the same paper mill.
TLDR: Links to the list of 121 papers: [English] Google Sheet – PDF – Excel format
Update 7/7/2020: Links added to list of papers in Chinese – with big thanks to TigerBB8 for the translation and for adding the grants: [Chinese] PDF
Paper mills
Paper mills are enterprises suspected of producing large numbers of scientific papers that include photos and graphs of experiments that never happened. They may have a laboratory to generate real photos of cells or tissues, but might sell these photos to represent very different experiments. In other cases, as with the Tadpole paper mill set that we previously reported on (also see reports by others here and here and here), images appeared to be completely fabricated, with unnatural looking Western blot bands or flow cytometry plots.
One example of those buying apparently made-up papers from paper mills appears to be young medical professionals associated with hospitals in China. Based on the requirements from these hospitals or medical schools, these doctors need to publish a scientific paper in an international journal included in the Science Citation Index (SCI) to qualify for a promotion and a more livable salary.
The papers produced by these paper mills often have a similar style, using title and figure templates and the same color scheme and layout for their figures. The topics of these papers often include microRNAs (miRNAs), long noncoding RNAs (lncRNAs), or circular RNAs (circRNAs), and frequently report on cancer research.
A set of 121 papers
The Stock Photo Papers that I identified match several check-boxes observed in other paper mill productions, although their similarities are not immediately obvious. But once I started searching for particular phrases and keywords, and comparing papers, I noticed the same plots and photos in multiple papers with different sets of authors from different hospitals.
As the list of these papers grew longer, more and more images looked familiar. After days of searching and comparing I reconstructed a pool of about 80 items, including different types of recognizable plots and photos. To be included in the Stock Photo Paper list [English: Google Sheet – PDF – Excel] [Chinese: PDF] a paper had to have at least one image and one phrase, or at least two images from that pool of 80 items. The list is currently 121 papers long. The oldest papers in this set are from 2017; the most recent one was published in June 2020.
Published in the same journal
The vast majority (113/121) of the papers were published in the same journal, European Review for Medical and Pharmacological Sciences (ERMPS). This journal also published several of the Tadpole Paper Mill papers, as well as papers belonging to “Paper Mill 2” identified by Smut Clyde. ERMPS is not published by one of the traditional scientific publishing houses, but appears to be a standalone journal run by a team of editors mainly affiliated with Italian universities.
With so many of these paper mill articles all published in the same journal, one might start to question why the Editors did not notice that so many of their papers look fake or similar to each other. One could even wonder if they actively collaborate with paper mills. Almost all papers published in ERMPS are from Chinese hospitals, have particular title structures, and cover topics such as miRNAs and lncRNAs.
A library of 100 images
Most papers in the Stock Photo set have four figures, each consisting of multiple panels. Roughly, they follow a similar layout:
- Figure 1: jitter dot plot and/or bar plots
- Figures 2 and 3: bar and line plots, photos of colony formation / wound healing / transwell / Edu assays
- Figure 4: bar plots, Western blots, correlation plot
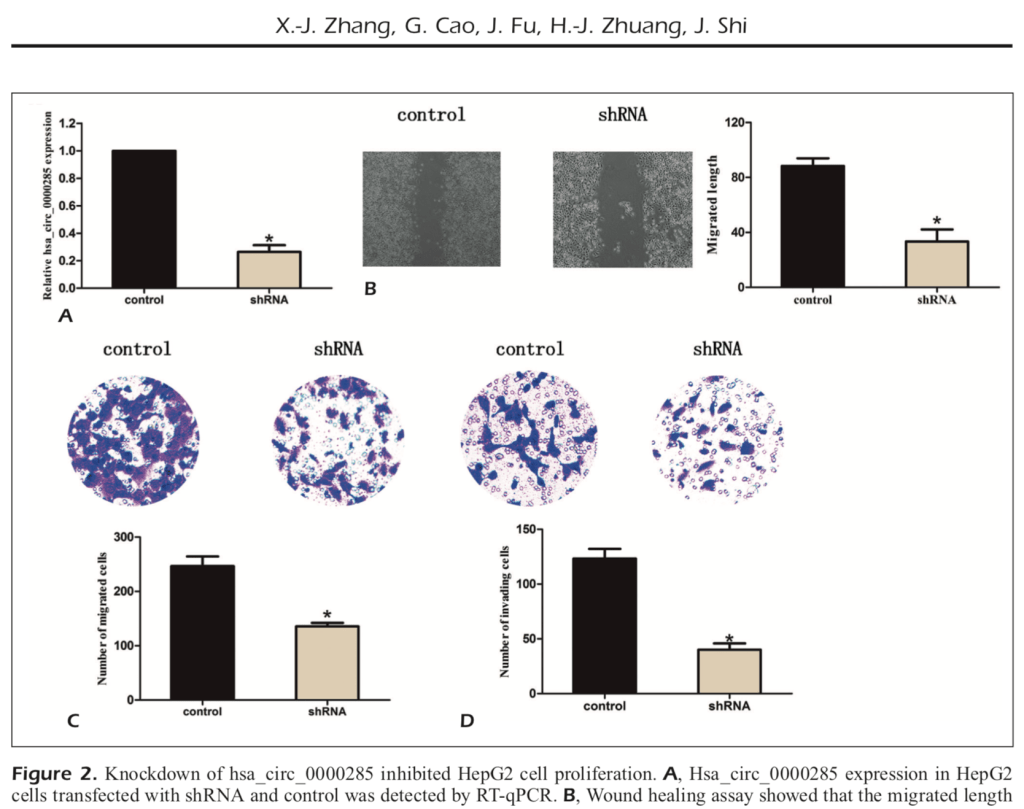
I did not focus on the bar plots, which anyone can easily draw without doing an actual experiment, and which are difficult to compare. Instead, I focused on looking for duplicates among the photos, flow cytometry, and correlation plots. As a “super-spotter” I can detect similarities and duplications within and across different photos.
It was quite some work to compare all the photos across these different papers, and to start recognizing them. Sometimes photos were rotated, mirrored, zoomed in, shifted, or given a different color. Going through all these papers, I started to make my own catalog of the stock photos. I gave each of them a number or a name, to help me recognize them and keep track.
The pool of photos and plots that I could identify include the following:
- 3 Kaplan-Meier survival curves (KM1-3)
- 15 colony formation assay photos (CF1-15)
- 7 EdU assay microscopy images (Edu1-7)
- 13 wound-healing (scratch) assay photos (WH01-13)
- 8 flow cytometry images (FC1-8)
- 23 transwell assay photos – showing invasion or migration (TW01-23)
- 8 Western blot photos (one of them is a set of many blots) (sWB1-4, gWB1-3, mWB)
- 9 correlation plots (positive or negative) (up1-5, down1-4)
The codes listed here are also included in the spreadsheet with the papers, so you can see e.g. which papers contained transwell photo TW01 or wound healing photo WH13. There are more photos in the suspected pool that I did not include here because they did not add much to the analysis.
There are also two phrases that lots of these papers included. These shared phrases in the legend of the figures – “Linear correlation between the expression level of [protein] and [RNA]” and “The results represent the average of three independent experiments (mean ± standard error of the mean)” – were how I found a lot of these papers. If you use Google Scholar to search for the first phrase or the second phrase, almost all of the hits are from ERMPS papers listed on the EuropeanReview.org website.
In total there are probably about 100 different stock photos and texts that are used in the figures of these 121 papers. Each paper in the list includes at least two of these items (average: 6.5 items). Each item was found in at least two different papers (average: 8.9 papers).
A typical Stock Photo paper might include e.g. four different transwell photos from the set of 23 stock photos and two Western blots from the pool of eight. Another Stock Photo paper might contain four flow cytometry images and two colony formation assay photos. Even though these two examples appear to look like unique papers, they have both been pulled from the same library of stock photos.
It is only when you see the complete set that the network becomes visible.
Let’s go over some of the examples and different figure types.
Linear correlation plots
Roughly half of the papers (76/121) contain linear correlation plots, usually presented as a panel in Figure 4 of the paper. As I wrote above, the sentence “Linear correlation between the expression level of [protein] and [RNA]” was how I found the first batch of these papers. Most of the papers that contain this sentence also contain one of the nine correlation curves identified in the stock photo pool. Of these, five show a positive correlation (“up” curve), and four show a negative correlation (“down” curve).
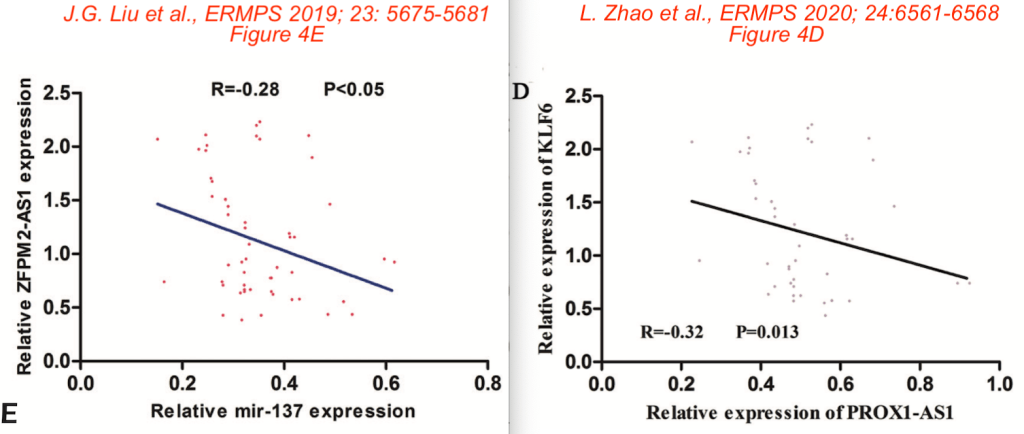
Take a look, for example, at these two papers:
- JG Liu et al. 2019 studies the effect of lncRNA ZFPM2-AS1 on mir-137 expression in renal cell cancer
- L. Zhao et al. 2020 studies the effect of lncRNA PROX1-AS1 on KLF6 expression in ovarian cancer.
Although the papers are from different authors at different institutions and studying different cancer types and molecules, the correlation plots are remarkably similar. It seems very, very, very unlikely that two different labs studying different diseases would find such similar data points.
Here is a graph with several examples that belong to either the five “up” curves (left) or the four “down” curves (right). Colored boxes show groups of data points that look similar. “Down1” was by far the most popular choice in this set; this particular plot was found in 25 different papers.
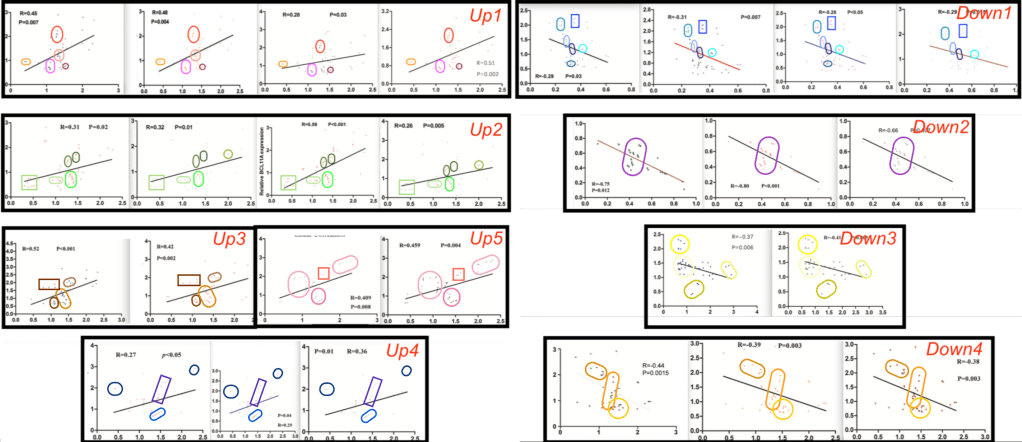
Download this graph as a PDF here:
Wound Healing Assay photos
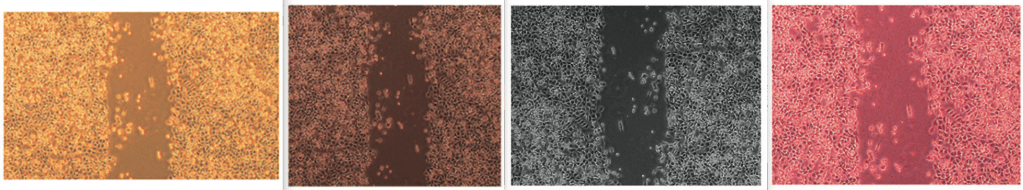
In a wound healing assay, which is sometimes also called a “scratch assay”, a thin layer of cells growing in a petri dish is scratched. This creates an empty strip where there are no cells anymore. Then the cells are supposed to grow back and close the gap. This process can be followed under a microscope. The speed at which the gap is closed is a measure of how well the cells can migrate.
There are at least 13 wound-healing assay photos used throughout the Stock Photo papers. Here I will show two of these photos.
Wound healing photo # 1 (WH01) has a T-shaped structure which resembles a hammer. So I called WH01 “The Hammer“. WH01 was found in 15 of the 121 Stock Photo papers. Can you find the hammer in the four examples below?
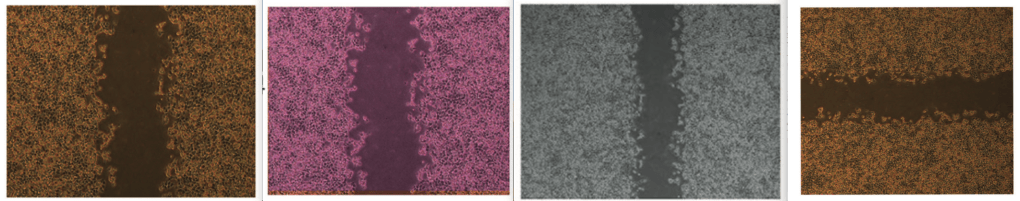
The most popular wound healing photo in the Stock Photo papers was WH02, “The River“. To me, it looked like a satellite image of a river with lots of little islands and boats. WH02 was found in 17 of the 121 papers.
Here is a link to a PDF with examples of all 13 wound-healing assay photos found in the Stock Photo papers:
Colony Formation Assay photos
In a colony formation assay, cells are tested for their ability to divide and form clumps of cells called “colonies”. Cells are grown in a petri dish or plastic well on a layer of soft-agar. Most healthy human cells cannot really grow well without attaching to something. But cancer cells can grow and divide in the soft-agar, without attaching to a surface. So if a cell type forms colonies, it is considered to be cancerous.
The Stock Photo Paper Mill pulls a selection from a set of at least 15 stock photos showing wells with different amounts of colonies. They are very versatile, really. For example, to show that compound X inhibits cell growth, two photos are shown, one with lots of cells and one with only a few cells. Or, to show that compound Y promotes cell growth, the same two photos are used, but then switched.
Within the set of 15 different colony formation photos, CF05, which I named “Saturn“, is the most popular, with 19 papers including it. CF15, “The Snowman” was found in 15 different papers. It has two groups of colonies, each of which looks like a snowman to me. Here are the CF05 and CF15 photos as found in four different papers, to give you an idea of how each photo can look totally different with some rotation or color adjustment. I have added rounded boxes of the same color to show characteristic groups of colonies in each of these photos.

Here is a link to a PDF with examples of all 15 colony formation assay photos found in the Stock Photo papers:
EdU Assay photos
In the EdU assay, cells are incubated with EdU (5-ethynyl-2’-deoxyuridine), which the cell then can build into its DNA. Cells that incorporate EdU are visualized under a microscope using a fluorescent dye that specifically binds to EdU. Cells that grow fast will light up more brightly than cells that do not grow.
The Stock Photo Paper set contains at least seven different EdU photos that I labeled Edu1 through Edu7.
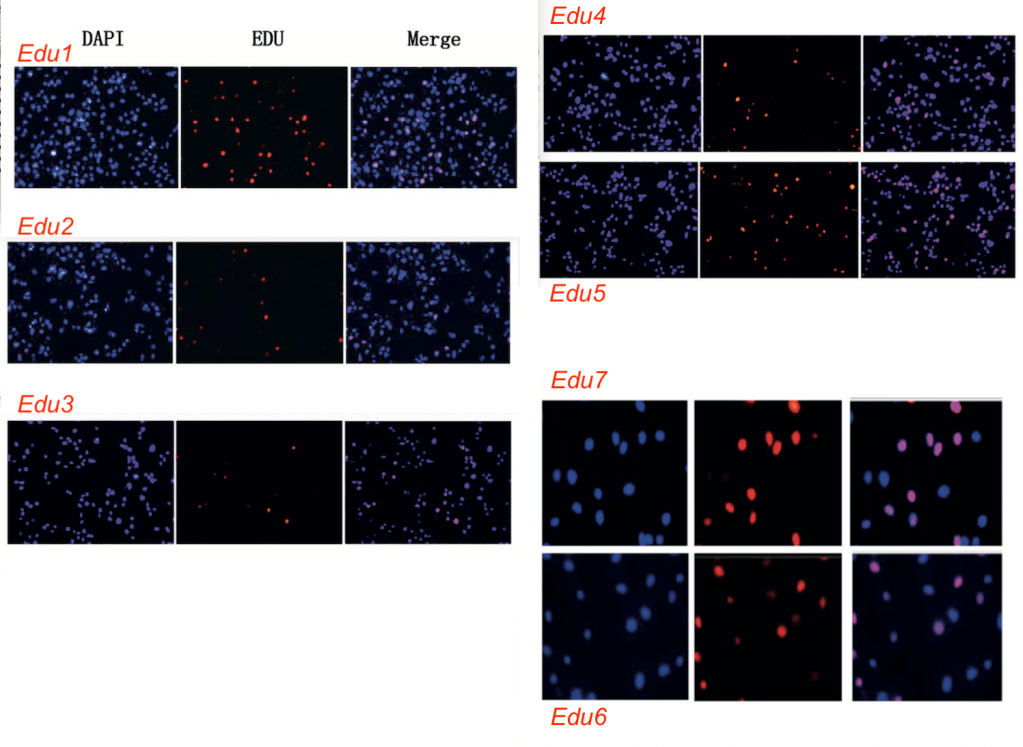
Click here to download a PDF version of the EdU photos included in the Stock Photo papers.
Transwell Assay photos
The transwell assay photos in these papers turned out to be the most complicated puzzle to solve. In this assay, the ability of cells to cross a membrane with tiny holes is tested and used as a measure for invasion and migration. These photos, taken under a microscope, show reddish, purple, or bluish colored cells sitting on a membrane with little holes.
At first, the Stock Photo papers appeared to contain hundreds of different transwell photos. But then I started to see overlapping areas, and the many different photos merged into 23 larger composites.
In the figure below, the photo on the left was used in a different paper than the one that featured the photo on the right. But they have an area of overlap, so they must have been derived from the same original sample. Can you spot the overlap between these two photos?
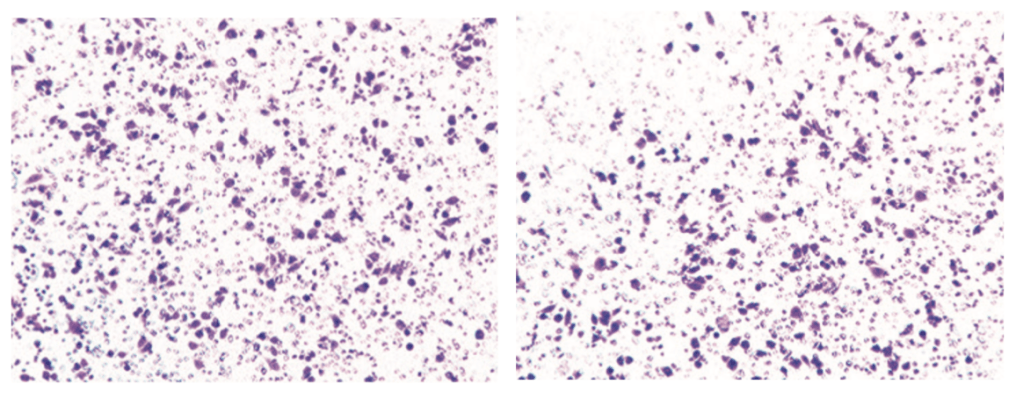
And here is the composite photo consisting of the two overlapping photos above – and many others. Each of the photos in the composite below came from a different paper. This was not an easy puzzle to solve!

You can also see an animation made by the Wall Street Journal here, featuring the “Green Egg” transwell photos that was included in 7 papers.
Here is a large file (90 MB) containing the 23 composite transwell assay photos included in the Stock Photo papers.
Other images
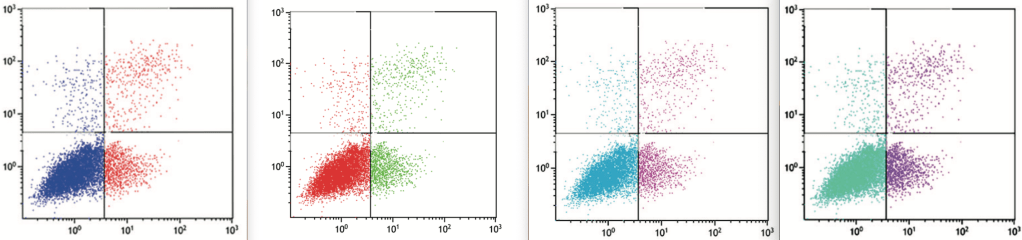
Other recurring images in the Stock Photo Paper set included Western blots, Kaplan-Meier survival curves, and flow cytometry plots. You can download PDFs including all these recurring photos using the links below.
The Western blot stock photos contained four different types of “smooth” panels (sWB1-4), three different types of “grainy” panels (gWB1-3), and a bunch of other photos that were often shown together as a set of multiple panels (mWB).
Three different Kaplan-Meier survival plots were found, if some variations were allowed. Here are some examples of the different plots:
Eight different types of flow cytometry plots, labeled FC1 – FC8, were found across the paper set.
What is next
I have reported all these 121 papers [English: Google Sheet – PDF – Excel] [Chinese: PDF ] to the journals in which they were published. The journals will hopefully contact the authors and/or their institutions to give them a chance to prove that they actually performed the experiments and that the data are real.
However, investigations such as these usually take a long time. For example, as far as I know, 400 papers from the Tadpole paper mill, reported around January 2020, are still largely untouched.
Just seven papers belonging to this set have been retracted.
But this means something like 99% of them are available for other unsuspecting scientists to trust, build upon, and perhaps even cite.
So what do we do now? Well, just patiently wait.


![Correlation Curves Up 1 to 5 and Down 1 to 4 [pdf]](https://scienceintegritydigest.com/wp-content/uploads/2020/07/correlation-curves-up1to5-and-down1to4.png.pdf)
Computer Vision offers photo “fingerprinting” methods for comparison of large image sets in a way that can be insensitive to rotation, cropping, colour changes etc. Ideal for scaling up this sort of work.
LikeLike
Lovely bloog you have
LikeLike